

RobinL
-
Content count
1,361 -
Joined
-
Last visited
Posts posted by RobinL
-
-
PS - keep a blank copy of PDF_CHART file for later use as a starter for this procedure again.
You can now reset your default printer to your normal printer.
RobinL
-
Hi Paul,
(1) Make your default printer a PDF pseudo printer.
(2) Reboot your computer
(3) Open Visual Chart Form with default blank chart
(4) File > Printer and check that the selected printer is the PDF one
(5) Tools > Diagram > Diagram Measurements and increase the size of the canvas to match or exceed the final combined chart size
(6) Save this chart under a new filename (say PDF-CHART)
(7) In VCF File > Open your first small chart and use CTRL+A then Tools > Structure > Group to make the whole chart one object
(8) In VCF , click the grouped chart, thenCTRL+C to copy the chart to the clipboard
(9) In VCF File > Open PDF-CHART, at the top left of where you want the first chart to be roughly located click the mouse
(10) that chart should be now visible
(11) repeat for other charts making sure that you place each appropriately (it is wise to save save temporary copies of the PDF-CHART)
(12) when you are happy that the individual charts are the right place, you an Ungroup them and edit them
(13) finally in File > Print look at the PDF Custom Page size and adjust it to a suitable size then close this File > Print
(14) reopen File . Print check that your settings have taken and then click PRINT
I hope that is sufficient to solve your problem
RobinL
-
Hi M. K. Miles,
I can quickly think of at least 2 reasons why you may get this result.
(1) It is likely that the indexing of some database table has become corrupted. Can you produce the list of People Report for the focus group of the person and all their relatives? If this fails then run the File > Maintenance > Reindex, etc and try again.
(2) You have run up against some constraint in the GenBridge code that Visual Chartform uses to interrogate the TMG project database.
In my experience, such a chart should not fail. I have produced charts that are more generations and much wider (up to 300 ft) and involving several 1000 persons from VCF.
Please report back,
RobinL
-
I would try creating the chart first with no images. If that works then it is likely that you have atleast one image whose format is not recognised by the tool that puts that image intoi the chart.
If the no image case works, then start wot create a chart with 50% of the final generations you require.
I that works then about 75% of the generations, or if the 50% failed try 25%.
Continuing halving the generations between the number that works and that doesn't under you find the generation that contains the faulty image.
Then you will need tisolate the images in that generation. Look at the file's extensions and their properties in something like Irfanview.
If the chart does not work without images. Then repeat this sequence with no images until you fiind the generation of failure. The most likely outcome is that you have a circular linkage of a child being linked as the ancestor of ancestor.
RobinL
-
The message FRMCHART5.CNTFILTERFLAG1.MSET CONTROLS
you are trying create a chart based on person with FLAG1 value = <somevalue>
This suggests to me that your first custom flag has some incorrect values or a bad definition
or that the focus person does not have that particular value set.
RobinL
-
Hi Kaye,
If CClenaer took that long then you must have a lot of files in its search paths. You probably now have a lot more free space on C: That may have now made TMG work. I am starting to suspect that it could also have been a lack of space on the hardrive. We will never know. As far as your other problems, I presume that you have sent yourself a message with an image back to yourself, either to your usual account or someone elses account that you can see. If you get it back in a clean form then the only thing can something in the header of the message that is causing it to be interpreted differently by others.
I am pleased that we seen have fixed the TMG problem.
RobinL
-
Hi Kaye,
Printer properties are funny things. Recently, I have found that changing the default printer is not propagated correctly to all Windows applications. It is only after changing the default printer, then shutdown, reboot, then open TMG or VCF that VFP sees the change. There is some ghost of the change that is left in memory, so the application does not see the real change until a re-boot.
If you use CCleaner to only clean out temporary files, after that it may take little while longer to load some websites that you visit regularly, but that is a small price to pay. The cache files will be re-established on that next visit. This is the kind of problem that can also happen when your computer crashes when a Word or Excel file is open. Next time you try to open the file, the lock file says that you can only open it in read-only mode. These lock files can be hidden almost anywhere, not to be found by searching (Windows search doesn't see them all). I recently had this problem with a mail merge macro in Word, where the only way to know where to look and delete the lock file was by correponding with someone in Cyprus. That's the Internet for you.
I have never found where TMG/VFP hides its lock files, unlike Word that uses "~$then the rest of file name.docx" in the same folder as the original.docx.
RobinL
-
Hi Kaye,
This sounds like your computer or TMG has been crashed sometime, leaving behind some lock files that would have normally beeen deleted on a clean close down. Repair does not look at these things, it on looks at indexes and data inconsistencies, not locks and permissions.
Or some background application has set locks for backup, cloud synchronization, etc and not cleanly finished.
Does the problem still occur if you open the Sample project and try to produce a report?
You may have to use something like CCleaner to remove all temp files (and only temp files) as a possible way to overcome this.
I hope someone else can think of another possible cause.
RobinL
-
Deeper invetigations revieled that this was set of files with very simalr naming conventions as does TMG,
But it infact was created by Roots Magic 3.0 (circa 2004). I have been able to open it and then export a 4.3Mb Gedcom from it and that Gedcom is on its way back to Gary. A good outcome alround, as he now has most the the data (I don't what doesn't get exported from RM3), but it also proves there was nothing strange about TMG v9.
RobinL
-
I received a Zip from Gary. It was an incomplete set of files, missing the PJC and all files relating tp _$ persons, _N names, and _P places. However, there is a lot of useful research information that can be seen via DBF browser.paricularly under sources, citations and exhibits. I have asked him to see whether the other files are still extant.
RobinL
-
Hi Glenn,
I have a working version of V6.12.000 on my XP machine. If you zip all the files and send them to me I probably can create a SQZ for you.
I may even have an earlier working version on a WinNT box.
Robin
-
Reinstall v8. It looks like uninstall must remoove a registry entry that v9.03 relies on.
If that doesn't work, I don't know.
RobinL
-
I'll try again to attach the example.
RobinL
-
The site gave an SQL error as it posted my previous reply
RobinL
-
Carol -
Virginia is correct. This is a known limitation of the application library that Visual Charform uses.
Try copying and then pasting the same line over itself. The last one becomes the top copy. Select it and changes its properties say 0 pixel dashed in a pale colour. To adjust the width and colour of the original send the top version to the back. Now select the the top copy and change its properties, than send that to the back to see the effect.
See the attached example of 2 of many pssible outcomes.
RobinL
-
While experimenting today, I found what I believe to be is an undocumented feature.
There are 6 types of elastic lines that you can select to join between 2 conection ports on boxes (and also to intermediate connection ports). When the object at the end point of a line is moved then the joining segment adjusts accordingly.
There are 2 forms of line
orthogonal - segments always horizontal or vertical
oblique - segments not constrained
There are 3 annotations for the end points of the lines
nothing - just the line is shown
arrowhead at one end
arrowhead at both ends
This gives the 6 types.
I discovered today that for the oblique line types
at each intermediate location where you click the mouse becomes a way-point.
Thus you can easily contruct an elastic multi-segmented path bewtween 2 locations on a chart (e.g. linking married cosins on a chart).
The intermediate points :
- are saved correctly in a .VC2 file and are redrawn as expected on re-opening
- may be edited by selecting the line and then "Edit Vertices" icon on the tool bar. That is, this line acts like other multi-segmented lines or shapes for editing.
This will certainly make manual annotation of charts much easier to perform.
The orthogonal line types are do survive the save-then re-open test but in the prosess loosing some of their properties in that saving or redrawing process.
RobinL
-
jak wrote:
Database Engine
.... MS SQL Server. All of Microsoft's development effort is targeted for SQL. It supports large databases, parallelism (multi-threading), multi-processors and it has been and continues to be optimized in various ways for maximum power and speed, as well as for rapid development. There are alternatives like Oracle, Postgres, and others, but I would stick with Microsoft which offers a rich software environment for development.
I believe that the major problem in moving to a more powerful database engine like one of those suggested is the IMPACT ON THE COST of the genealogical application. Unless Wholly Genes can use a FSF open-source database like Sqlite, it is probable that the individual licence cost would double or triple - making TMG non-competitive in the lower end marketplace. BTW: Sqlite is used in many common free applications like Mozilla Thunderbird and Firefox. UNICODE support is extremely important, but escaping from the obsolete VFP is even more important. That escape should automatically provide UNICODE support..
As far as data interchange is concerned, a rigid definition for interchange will never be satisfactory as the needs of genalogists and historian's continue to evolve (e.g DNA testing). XML is the best extensible vehicle for this data transfer in the future. Some XML examples have been explored, but there is a general lack of will in the family history software industry to provide this type of data interchange (as it would diminish the customer lock-in to a company's product).
RobinL
-
Kim D,
If you want to print a chart of that size, there are 2 contraints to be aware of.
1) For output over a specific size (can be as little 200") you will need to find a print shop who has the right software to go further.
2) Typically, the roll length available on most printers for 80gsm paper is about 30m (115ft), but the roll length decreases as you go to thicker paper.
I would recommend thicker paper for a large chart as this paper tends to tear easily.
RobinL
-
Kim,
There are several possible constraints that you might be running into:
1) VCF is a 32 bit application, so it can only address less memory than a 64b application could.
2) If you are including images, thenand there are many this could use a lot of memory.
3) My "back of the envelope" approximation of your chart is as follows - assuming that not many sequences go past say 12 generations. Let us assume that the chart was FULLY populated back 12 generations, (ie 4096 ancestors at this generation and 8192 acestors in overall chart). Now at 2 inches per person box, 4096 * 2 this leads to a chart would be 862 feet across. (Hope you have some where to display it.) I have got VCF to show a 300ft wide chart on a XP box with 500Mb menory.
4) Another reason that VCF could fail is if somehow there is an error in the ancestry where a person is incorrectly linked, typically an ancestor's parent is linked to a later descendant as their parent.
Try your Ancestor Box Chart with fewer genertations (say 6 for a start), Note the chart size (Tools > Diagram > Diagram Measurements) for undertanding of the size increases.
Repeat making the chart, increasing the number of generations in the chart until it fails.
When you have some more infomation please post it on the Forum.
-
There are 2 likely causes to this kind of problem.
1) If you select unusual fonts then you must ensure that both computers creating and viewing have those fonts installed.
2) You also get this kind of problem if one computer is using a different screen DPI value from the other. (default 96).
RobinL
-
Rosanna,
I suggest another tactic. Create document in Word 2010, Use some drawing objects to create vertical and horizontal lines of black and some other co9lour. Now print that document. If that works then the issue must be with TMGW and not your printer. How did you save the chart (and what format -JPG, BMP, etc did you save it as) to insert it into Word?
Can you view that saved chart file in an image viewer without strange effects?
Regards,
RobinL
-
This is a printer problem. Do a test pattern that shows the alignment of the heads (for all head jets). These usually will show that some jets are not firing oar are not aligned. Believe or not on some colour printers even though they have black ink. Some operations create black by firing magenta, yellow and cyan as well. I suspect that some black jets are not firing and the same position has at least one colour that is not also firing.
-
Just be aware that there are some operations that require only 1 copy of a project to be open.
Anything that will make a global change or make a backup, etc.
I did have a list of these somewhere but I can't find it easily.
If I remember correctly with 2 copies open you can't define a new flag, but one it is defined you can set it by a report when two copies are open.
-
I thought I would share with you what you can do to create a chart that shows all persons in a project who are connected together.
This single A0 (47" * 33") page has 254 persons on it. It was created in a number of steps and used flags to identify focus persons and overlaps of descendancy. The blue lines highlight the ancestry of a family but also shows the siblings and their descendants as far as they were recorded in the project. It is the result of 18 separate executions of Visual Chartform which have been edited and linked together. Where for the best use of space the chart has to be broken into pieces, then the curved dashed blue lines go between 2 boxes that represent the same person, usually a female who then becomes the wife in a more extensive chart piece.
I present it to show that Visual Chartform is a very powerful creation and editing tool.
RobinL
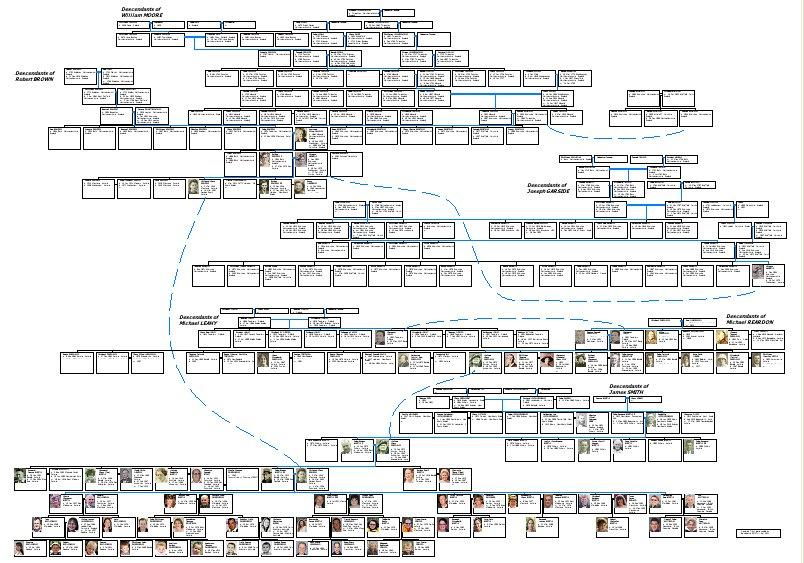
Chart printing
in Visual Chartform and Chartform Delivery
Posted · Report reply
I presume by charts you are referring to Charts created from TMG using Visual Charform.
In Visual Chartform any export method that uses output to a grid based image format with loose quality as it is based on a screen capture process..
PDF is a vector method of representation. That is, it stores in the PDF file, location of objects as positions to 1/96 of an inch, it stores text characters as text characters. Depending on the PDF converter that you use, the way images are stored may be different. If possible, I would always save the as at 600 DPI or 720 DPI file if you are given the option. Make sure that you can print at that detail.
A second more delicate issue is the choice of colors. I would create a small test chart using your selected colors for different objects and take the PDF to your preferred printer and get it printed by the printing device you will finally use. The color on your screen is likely to be brighter than any paper printing, so you may need to revise your color choices.
I hope that helps.
RobinL