

Mike Talbot
-
Content count
361 -
Joined
-
Last visited
Posts posted by Mike Talbot
-
-
Microsoft is withdrawing their MS Office Live website hosting service needed for my LAgenealogy web site on 30 Apr 2012. At least they gave notice of the pending execution date. Microsoft’s new replacement hosting service is totally incompatible with their old. They offer no conversion programs to assist the user in transition.
Since I will have to redo the site, from scratch, anyway, I'm searching for a more reliable host company and may have found one. Daughter, Kris, has been a big help in this. A “work in progress”, limited site is and will be temporarily available at URL
http://lagenealogy.zxq.net/Talbot.html
Navigation between pages is the same as with the old site. All 90 pages are there..
If you want to copy anything to your computer from the old site, please do so before the above date. All of the old site items are available on the new temporary site, but not fully tested.
Mike
-
This example is presented for an exchange of ideas.
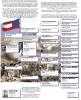
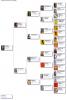
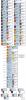
Recently, I was asked to produce a chart showing Brooke Shields' connection to the current Grand Duke of Luxembourg. As it turns out, her 2nd cousin is married to the brother of the present Grand Duke. I had never considered doing such a relationship by marriage chart before. The hardest part was visualizing how best to show this. The VCF work took little more than an hour. Work? It was fun!
Attached is the resulting chart in two formats, JPG and PDF using CutePDF Writer (for viewing by us visually challenged folks). It is a composite of 3 ancestor charts (most of the needed boxes) and 2 descendant charts (just to get spouse boxes). The chart layout fits a landscape, letter sized page. The individual techniques involved are explained in old posts by Virginia, Robin and me. Suggestions? Questions? Comments?
Note: My apologies, some liberties were taken with the long nobility names.
Best wishes,
-
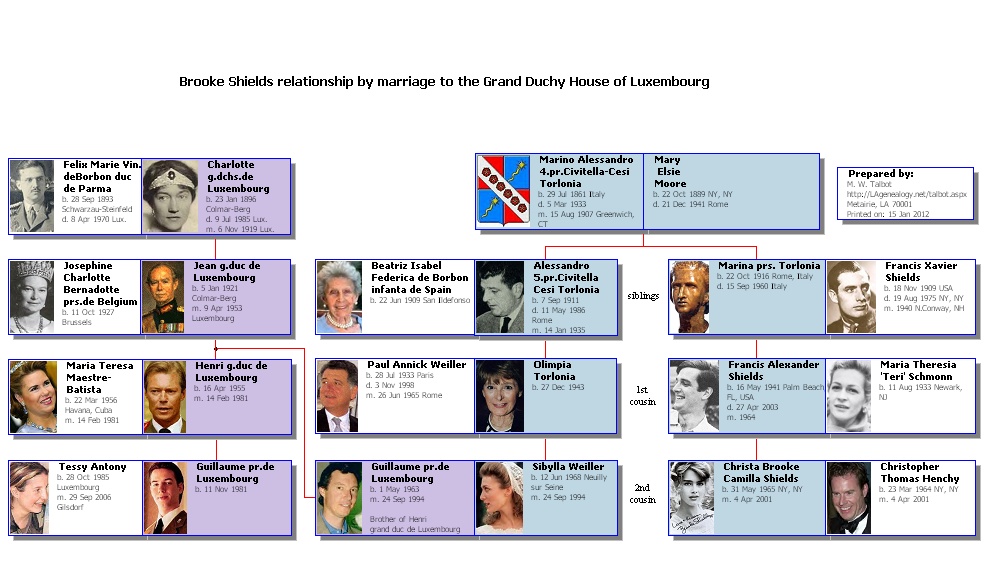
Please read and understand Virginia's reply. As Virgina said, make frequent inttermediate backup copies of your VCF chart, during editing. The purpose of this reply is to give an example and some restrictions.
I prefer JPG format pics to import into VCF. BMP and a few other graphics formats are also supported for VCF importation.
PDF file import is not supported by VCF. You must first convert the PDF file to a graphics format that VCF can handle. That topic is best addressed in an ADOBE forum or support group.
The size of a VCF imported graphics file must be smaller than your VCF."canvas". You can make your canvas really big to begin, then trim it to your desired page size later.
In the following example the ancestor chart was generated and edited to fit on letter size paper (see the 5 generation chart topic in this forum from July). The techniques work on any reasonable size..
Expand your canvas size to be larger than the background picture and then import it. It is best to have a picture slightly larger than the desired final size, resolution will not be lost when you resize it. Move the picture to the upper or left edge of your page to serve as an anchor for resizing the picture.
To resize, select the picture, it is still covering part of your chart. You will see 8 dots around your picture, one at each corner and one at the mid point of each border. Place the mouse cursor on the lower right corner dot, while holding down the left mouse button. If you want.to preserve the picture's aspect ratio, simultaneously hold down the keyboard shift key. Move the mouse while holding down the left button toward the center of your picture until it is reduced to your desired size (probably when it is at or within the opposite page border from your chosen anchor border).
Now use the BACK menu entry to place your picture in the background, behind your chart. You may now move your background picture to yor desired location, since you can now see what parts of the background are covered by your chart.. Don't be afraid to slightly move a few chart components if they cover a key portion of your background. Finally, perform other desired chart editing and trim the chart to the final desired size.
There are two background pictures in the attached example chart plus three person boxes copied and pasted from other charts. The identical example chart is shown twice in both JPG and PDF format. It is easier to do than to describe.
Good luck,
0Ancestors_of_Gen__Pierre_Gustave_Toutant_Beauregard.pdf
-
1. There is no column identifying the Topic originator in the new forum list of Topics. .Important!!!
2. One has to log in to view attachments within a Topic message. It's not convenient to do this. A royal pain in the posterior.. Ignore item 2, my mistake.
3. The two line Topic Title has been reduced to one. Need one line for the feature, the second for the problem detail as of old.
4. To view old Topics within a forum, one must laboriously go one page at a time. The old software allowed one to go directly to page 4, etc.
5. The Topic avatar thumbnail sometimes makes me look too fat. Aspect ratio, anyone?
Can these new shortcomigs be fixed?
Best wishes,
-
Where a forum quote ends and a reply starts is not obvious nor even discernable, and should be with the new forum support. IPS seems to be a step backwards for supporting a forum, so far.
What was the matter with the old forum support?
Best wishes,
-
I am using TMG v.8 in Windows Vista and printing to a Canon Pixma IP4600 printer.I can set up charts in VCF with some lines solid and some dotted. Print preview shows the correct result. When output goes to my printer I can also ask for a preview and this also shows the dotted lines correctly. But when I print I just get solid lines. Do others get this problem. Is there a fix and if this is an inherent problem with VCF is it going to be fixed.
This has been a problem for several years and I was hoping that with the release of TMG8 it would have been dealt with.
Ditto.
A work-around that works for me (TMG7/XP):
Install the Cute PDF Writer program as a printer. Use it to print your chart that contains dotted lines to a file from VCF. Print the chart PDF file to a printer using Adobe Reader. Dotted lines are on your hard-copy. Magic, in one easy extra step.
Another advantage of VCF charts in PDF file format is that you can magnify your chart on the screen on in print using Adobe.
Good luck,
-
Merry Christmas and Happy New YearDitto for 2011 and 2012,
-
It seems that I can not make anything other than an image as a primary exhibit. This is for a person focused exhibit - not an event exhibit. JPG's and TIFFS's seem to work but PDF's, word documents and text do not. The "primary" button is not available. Can anyone tell me if that is just the way the program is structured? If that's the case are there any work-arounds? Thanks in advance for any suggestions you can provide. BillPlease tell us and give an example of what you are trying to accomplish with a non-graphic primary personal exhibit.
The personal exhibit that you select as primary only affects the relatively small image contained in VCF chart boxes and the small image that appears in the exhibit editing window. Non-graphic format exhibits may be selected for any other function.
Best wishes,
-
Thanks once more Virginia, I do follow up all your tips and find them very useful. I see what you suggest re spouses and that certainly does help. Pity one needs to visit each and every spouse in the chart (in VCF) and fiddle around to accomplish this but it does do the trick. thanks a lot RogerTips:
You can group select all spouses (as Virginia's tutorial instructed), within a generation, and move them by jogging all at once. I like for the spouse box to overlap or at least touch the descendant box (a matter of personal taste). Then you can group select all of those nasty spouse connector lines, within a generation, and delete them once. Then move on to do the same for the next generation, etc.
I like to color fill the descendants' boxes and leave the spouse boxes uncolored. To do this, it is best to leave a little horizontal offset of the spouse from the descendant. If you change your mind on the coloring, later, the offset allows group sections for color changes.
Some like to generate a large bold single character equal sign (=) and place it between/overlapping each spouse and descendant. It can be rotated 90 degrees, when desired. (generate it once and make and move copies)
Enjoy,
-
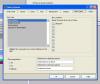
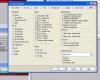
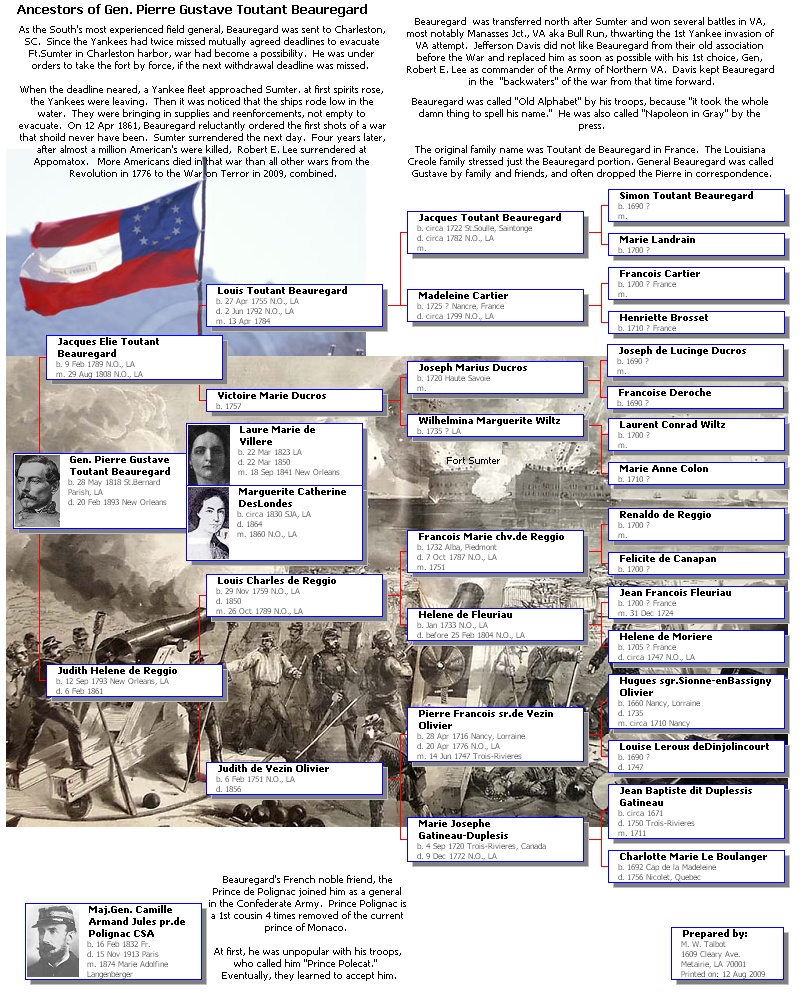
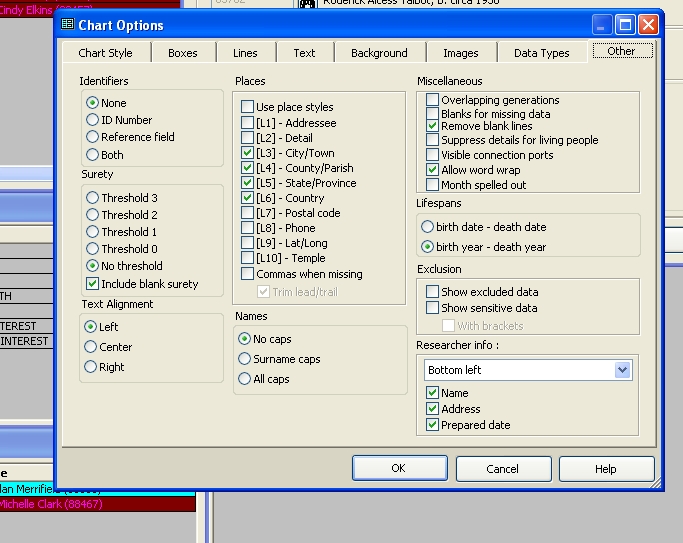
The Lifespan option is on the Other tab (right-hand column) in the report definition screen in TMG for the descendent box chart. There are options for date-to-date or year-to-year for the Lifespan. If you found that and ticked the box I have no idea of why it did not appear in the chart.You can start with a box width of 100 and 8-point font - no frame and no shadow, just a box with a single 1-point line. You could also try the Waterfall format on the Lines option in the report definition. Have you checked out Mike Talbot's examples in the pinned message at the top of this forum?
Virginia
Hi Virginia thanks for trying to help me. I'm happy with everything I'm doing here and think Terry Tips will sort out my VCF edit problems. At present my remaining question is "I did see the Lifespan option and ticked the year to year option box but when I saw nothing appear on the chart sort of forgot about it. What else do I need to do to get it into the chart?? " Any guidance I can get on that particualr point much appreciated. thanks again Roger
Sorry Virginia I now see you already said you don't know why the Lifespan data failed to appear. Guess I will wait to see if anyone else can make a suggestion.
OK I've found out what to do now. So end of thread I think. thanks everyone Roger
Check your Report Definition > Options
They should look similar to the attached to get minimum size with lifespan
Good luck,
-
How does one insert a link to an old forum message into a new message?
Thanks,
-
After using Pathwiz, I can't seem to back up my project. I get an error message: Project in use elsewhere, and a reference to a sessionkeeper.dbf. I never tried to backup with Pathwith open, and I only use it on one computer. I also keep losing my accents (which never happened before) Any ideas?Thanks,
Afina
Have you tried to "reboot" ???
Good luck,
-
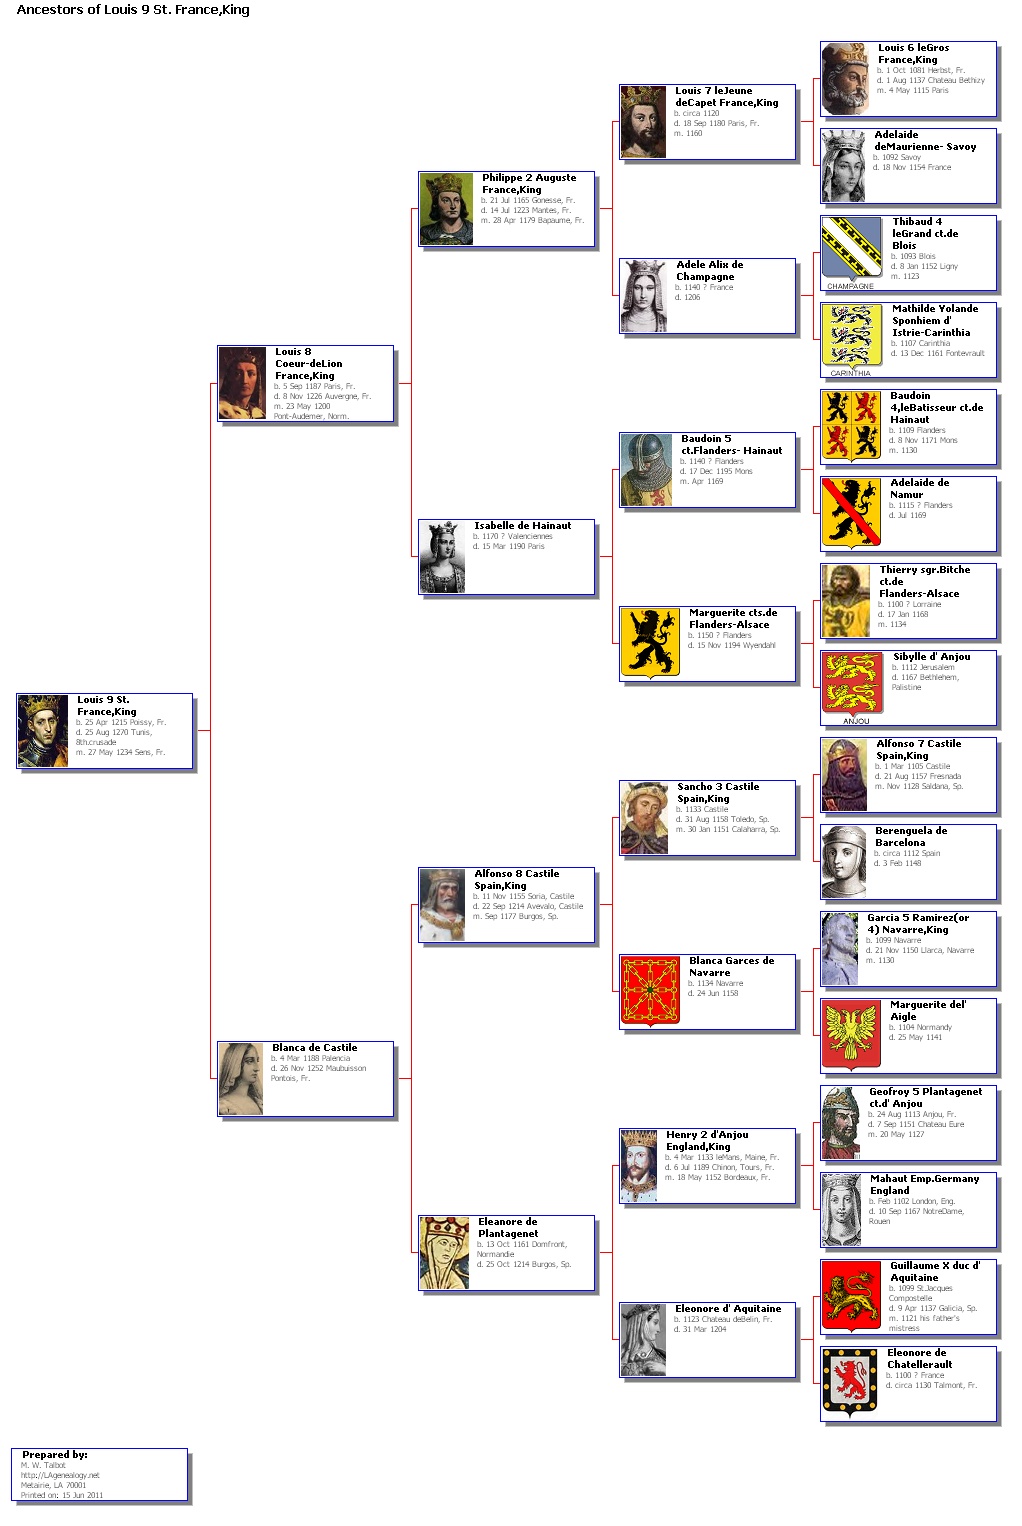
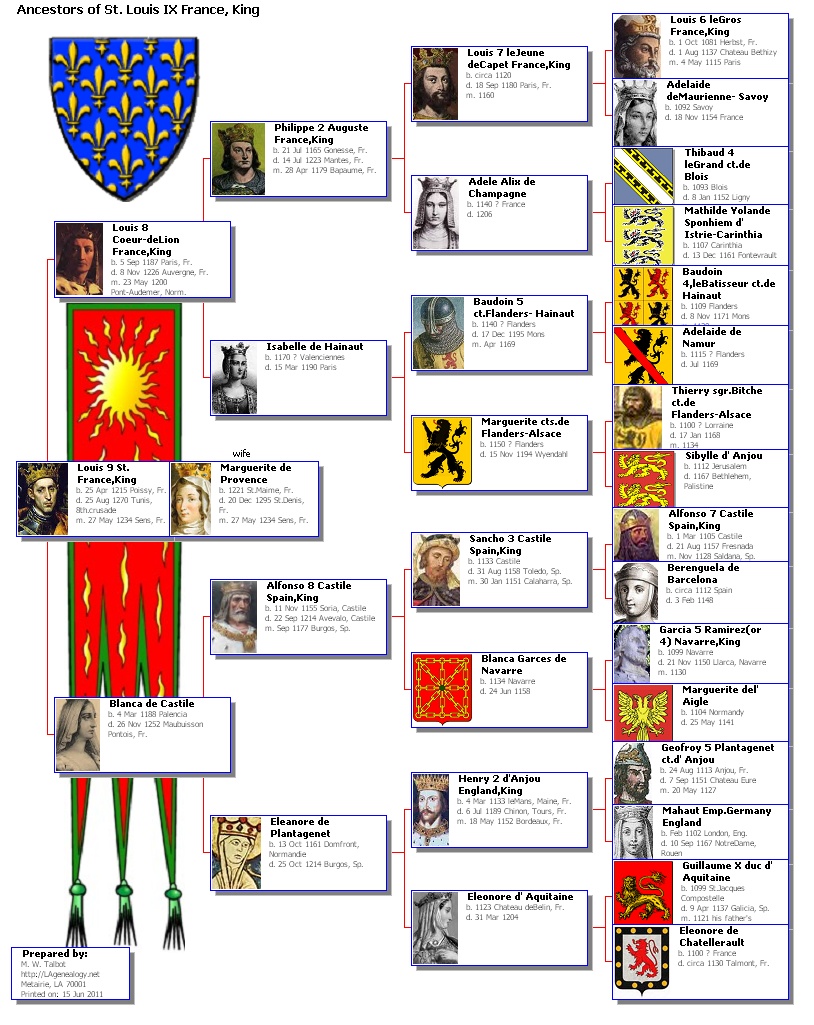
When you have images for all 31 people on a 5 generations ancestor chart, the simple 30 second fix shown in the first example in this topic will fail to fit an 8.5 x 11 in. (standard US letter size) sheet of paper. In this example, the raw VCF chart generated was 10.5 x 15.5 inches.
You will need to reduce the height of this chart, as well as its width. To do so will take a bit more than 30 seconds, but less than 10 minutes.
1. Generate and edit your 5 generations chart as per the first message in this topic. You now have an 8.5 x 15.5 in. chart in this example.
2. To reduce the height of the chart, group-select all chart components for the 15 persons at the bottom of generation 5 all the way to the left edge or the chart. Jog the selection upwards until the 2nd person's box overlaps the 1st persons box in generation 5. At first, take care that you do not cover any important information in the box that is being overlapped.
3. Now, group-select all components for the 14-5th generation bottom persons in the chart. Jog the selection upwards until the 3rd person's box overlaps the 2nd persons box in generation 5. Repeat this step until you have moved up and overlapped all boxes in generation 15.
4. You may now twek your moves to achieve your desired chart height. If you must cover some important data in a 5th generation box it's OK. Most charts from other products don't support a picture for 5th generation folks and replace BMD data with something like life span. Finally, trim your chart.
Notes:
1. I always copy and add spouse box(es) from another chart, overlapping the subject..
2. The name of the chart was hand edited to show that it can be done.
3. The subject, spouse and title boxes were narrowed just to show that it can be done.
4. The 10 minutes of VCF work includes all the items in these notes.
5. You may assume that these techniques work for any reasonably sized sheet of paper.
6. It will be easier to work with the Zoom-to-Fit menu entry invoked. Import an external pic or two.
7. See other posts in this forum for details of the techniques needed.
Enjoy the results of VCF editing to get your charts done your way,
-
When I try to make a descendant box chart and port it to Visual Chart Form, I get the following error:Error Reading Individual's Name
ID – 31,132
Error Number 1
Error Message = End of List
It will go on and make the chart, but there are no names in the boxes after the 5th generation. It will show dates & places in the boxes, but no names.
ID 31,132 is certainly not the end of the list, as I have almost 80,000 names and the last ID number is about 76,000.
[/size]
This chart has about 1,500 names.
Any ideas on the problem?
It seems that you used the Save to File option to output your chart. I always use the View in VCF option. View in VCF lets you view and edit the chart and then save it to disk. I never output any chart directly to disk.
The largest descendant chart I have ever successfully done was 4 generations with a bit over 600 people (see http://LAgenealogy.net/Talbot.aspx). I moved components about in VCF and reduced the size to about 8.5 x 200 inches. I generated one with more generations and about 2000 people. It generated OK, but my computer was too slow to move components about, It took over a minute of run time to move one selection of components. I guessed that I had over two thousand moves to make and gave up on that huge chart. I generated several smaller charts instead.
I had 3 gigs of main memory back then (2 gigs now). My data base is comparable to yours with over 87,000 people and 13,000 images.
My first guess at the cause of your problem is insufficient memory. Have you tried to generate with only TMG/VCF running? Can you give more detail on the nature of your chart and machine. How does it compare with the 600+ persons chart linked to, above?
To make a long story short. I don't know, these are just thoughts.
Best wishes and good luck,
-
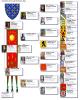
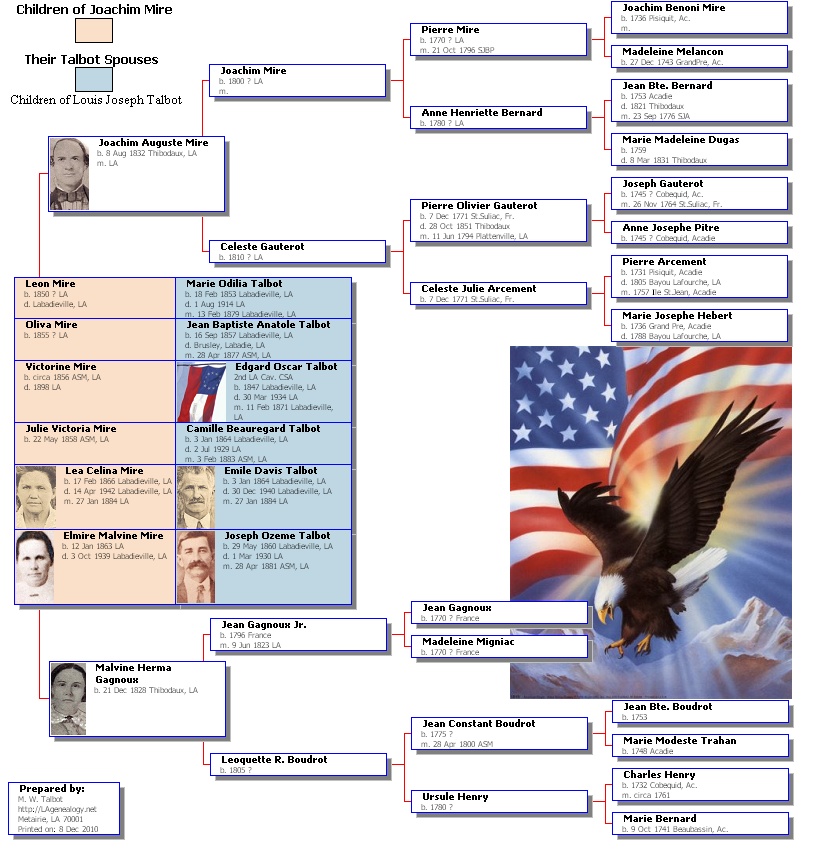
Now and then you run across a family that many cousins would enjoy. The attached chart is such an example. All of the children of one family married children of another family,
TMG gives an option to display siblings, but siblings are displayed for everyone. This often results in a huge and confusing ancestor chart, when all that you want are the siblings of the subject and their spouses. The standard TMG ancestor chart with siblings does not show spouses.
1. Generate and edit an ancestor chart of one of the desired siblings as per the Gen.Patton chart beginning this topic.
2. Generate a two generation descendant chart of either parent of the siblings.
3. Delete the connector lines to all siblings and their spouses. Note that many of the lines can be selected and deleted in groups.
4. Arrange the siblings in a column and their spouses in another adjacent column as seen in the attached final product.
5. You will note that some siblings boxes are larger than their spouses. Simply add blank lines to the smaller of the spouse boxes to make the box sizes compatible.
6. Note the total height of the sibling spouse column on the modified descendant chart, You will need to open that much space on the destination ancestor chart.
7. Use diagram measurements to make the ancestor chart height 11 inches. Then group select the bottom, maternal ancestors and jog them down to open the chart for the siblings with spouses from the descendant chart to fit.
8. Copy and past the sibling couples from the descendant chart to the ancestor chart. Move them to the desired location, add any explanatary text and trim the chart.
This took less than an hour to do and is easier done that said.
Best wishes,
-
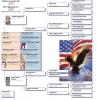
Another way of displaying this complex family would be with a single one page composite of VCF Descendant box charts. The attached chart was originally a "Yours, Mine and Ours" composite of 2 Descendant Charts. To add a level of complexity to your scenario a fake spouse and child were added to make it a "Yours, Mine, Ours and Theirs" Chart. Selected boxes were colored, with explanatary text, to improve clarity.
The grandparents were then added from other charts to gild the lily.
Editing the original YMO chart into a YMOT chart took only a few minutes. The original YMO chart took a little over an hour to construct (after practice).
Note that the VCF chart fits on a single letter size page. TMG reports would take several pages and would not have the clarity, pictures nor sizzle. Techniques for accomplishing the individual operatios required to make this example chart may be found in the VCF forum under topics by Virginia, Robin and me if needed. VCF hand editing can seem to accomplish miracles.
Best wishes,
chart errata: Parents and descendants of Henry Watkins with Amelie Gounin should read Children of Henry Watkins with Amelie Gounin.
-
Thanks for this interesting topic. After browsing the links provided, most every genealogy program could produce ancestor and descendant charts. I saw no mention of any having the ability for the user to hand edit charts, such as VCF. Most programs can build, display and allow editing genealogical data, acceptably (some, so little better than others).
If I had to pick the most important feature of a genealogy program, to me, it would be providing the ability of editing charts (like with VCF). The second most important feature is the ability to edit reports with a word processor. I have never seen a standard computer generated chart or report that was exactly the way that I wanted it to be.
Is this hand editing ability only of prime importance to me? Does any other genealogy program have these charting features? This feature seems to be ignored in all of the reviews. Is it ignored because the ability is so rare in existing products, or is it because so few care?
Thanks again,
-
Terry's suggestion is a good one.
I saw no mention of "Verify File Integrity" in your list of File Maintenance actions. VFI gives you the opportunity to fix any bad links to external exhibits. To use it, run VFI, it will ask for additional folder names where external exhibits might be found. Enter all folder addresses where you keep exhibit files (you need not mention the default folder specified in your preferences). VFI will search these folders for each exhibit file name and repair addresses when necessary.
At the end of VFI's run, it will display a report containing the number of exhibits not found, if any. If this number is not zero, you forgot to mention an exhibit folder(s) (or those exhibit(s) are truly missing) and may cause problems for you. If so, ask for a procedure to find what file names are missing from which IDs, in this forum.
It is suggested that you consruct a text file containing all of your exhibit folder names. Then, each time you run VFI, you need only copy and paste the folder addresses.
Good luck,
-
I've had TMG from just about the very beginning. I still have a Tutorial with a yellow cover dated 1996. I think that I no longer have what came before that in the way of disks and manuals. So I've been using TMG for at least 15 years.During all those years I've felt a loyalty to WG. Now I don't see WG returning the same loyalty to us as users. They have promised v.8 for several years now and keep saying that it is coming, coming, it's almost here. The latest promise that I remember was it would be not ready by last Christmas but coming very soon and we could pre-order and save 10% when it does come out.
Why are we being kept in the dark? I'm beginning to wonder if it really is going to happen.

UPDATE: I just found my "Getting Started" manual for Version 1.0, dated June, 1993. So I guess I really do go back to the roots of TMG.
Still a loyal but worried fan of TMG. Have been in the TMG fold since early in V.4 (1999).
Having been into computers since 1961, I have never seen the chaos TMG has faced during the life of TMG 7. Microsoft has churned out 2 different operating systems with little thought to quality, "upward compatibility" and its users (I paid extra to not be "upgraded to Vista" on my last computer purchase). FoxPro has pulled the plug. With that triple snake bite, there can be little surprise that TMG plans have been greatly adversly affected.
Patiently waiting and hoping,
-
I am having trouble with the TMG 7 Automatic Relation Tag. This is not the Ctrl+R Relationship Calculator, which is working fine. This problem is with the Automatic Relation Tag at the top of the big Details window. (You turn it on in Files>Preferences>Current Project Options>Other> Automatic Relation Tag.)My family is very interwoven. I frequently have a line that weaves into another line, changing (for instance) a cousin into a grandparent. When I re-run the Automatic calculation, the cousin's relationship should change from cousin to grandparent. Most of the time, the relationship changes, but sometimes the Relation Tag retains the old relationship (it still says cousin instead of grandparent). When I run the Ctrl+R Relationship Calculator, it shows that the "cousin" is indeed a grandparent, but sometimes I just can't get the correct grandparent relationship to show next to the Automatic Relation Tag. I also have an Accent running that highlights my direct line in turquoise, so I have two other systems that verify that the "cousin" is a grandparent. It bugs me that the Automatic Relation Tag keeps the "cousin" relationship, though.

I have tried
1. disconnecting, re-running the calculcation (on the Other page) and reconnecting. This method is time-consuming. When I hook them back up, and re-run the calculation, the relationship reverts back to cousin.
2. I tried turning off the Automatic Relation tag, re-running the calculation and turning it back on. That didn't work either.
3. In desperation, I even tried turning off the Accent (I have one marking my direct line), and turning it back on. That didn't work either.

Is there a fix for this?
Thanks,
GeneQueen (aka Kim)
I agree with Jim. When I had a similar problem, a few years ago, the cause was that a parent of an ancestor was not marked as primary (three of my grandparents are 4th to 6th cousins and several of their ancestors are cousins).
Good luck,
-
I'm baffled by vanishing shadows on box charts. I've been using 7.04 for some time, making many box charts, with a standard gray shadow on the boxes. Tonight I made a bunch of these charts (output to BMP) and at first couldn't figure out why they looked funny. Eventually it dawned on me that the shadows were missing. I tried changing the shadow settings - no joy. Tried outputting to Visual Chartform - still no shadows. Is this a known issue? Hopefully there's a fix?Have never seen this problem and know of no way for the user to cause it. Since you have already verified the chart definition enabling shadows, there seems to be only two possibilities left. Either a computer glitch has disabled shadows or a glitch has changed the shadow color to white. To see which, in VCF draw a large rectangle around any person-box, color it any dark color, use the menu to send your rectangle to the back where the original person-box is visible and note whether there is a white shadow or not.
You now have a detail to tell tech support or you could just reinstall TMG.
Good luck, please let us know how it turns out,
-
Gary -Re step 3, above. To change the dimensions of the chart, do not use Resize. On the same menu, use Diagram Measurements to set the new size. VCF will not change the box sizes in this case.
You may get some ideas from the tutorial videos in the pinned message at the top of this forum. The videos are short with no sound (the accompanying messages explain them). To print a forum message, go to Options in the upper right corner of the message and click on 'Print this topic'. A couple of the tutorials are on connector lines and their junctions (which I call Rubik's cubes). You want to watch out for those and use them to align boxes and lines correctly.
Good luck. Ask if you need help -
Virginia
Please tell me how to find Gary's original question/message.
Thank you,
-
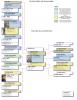
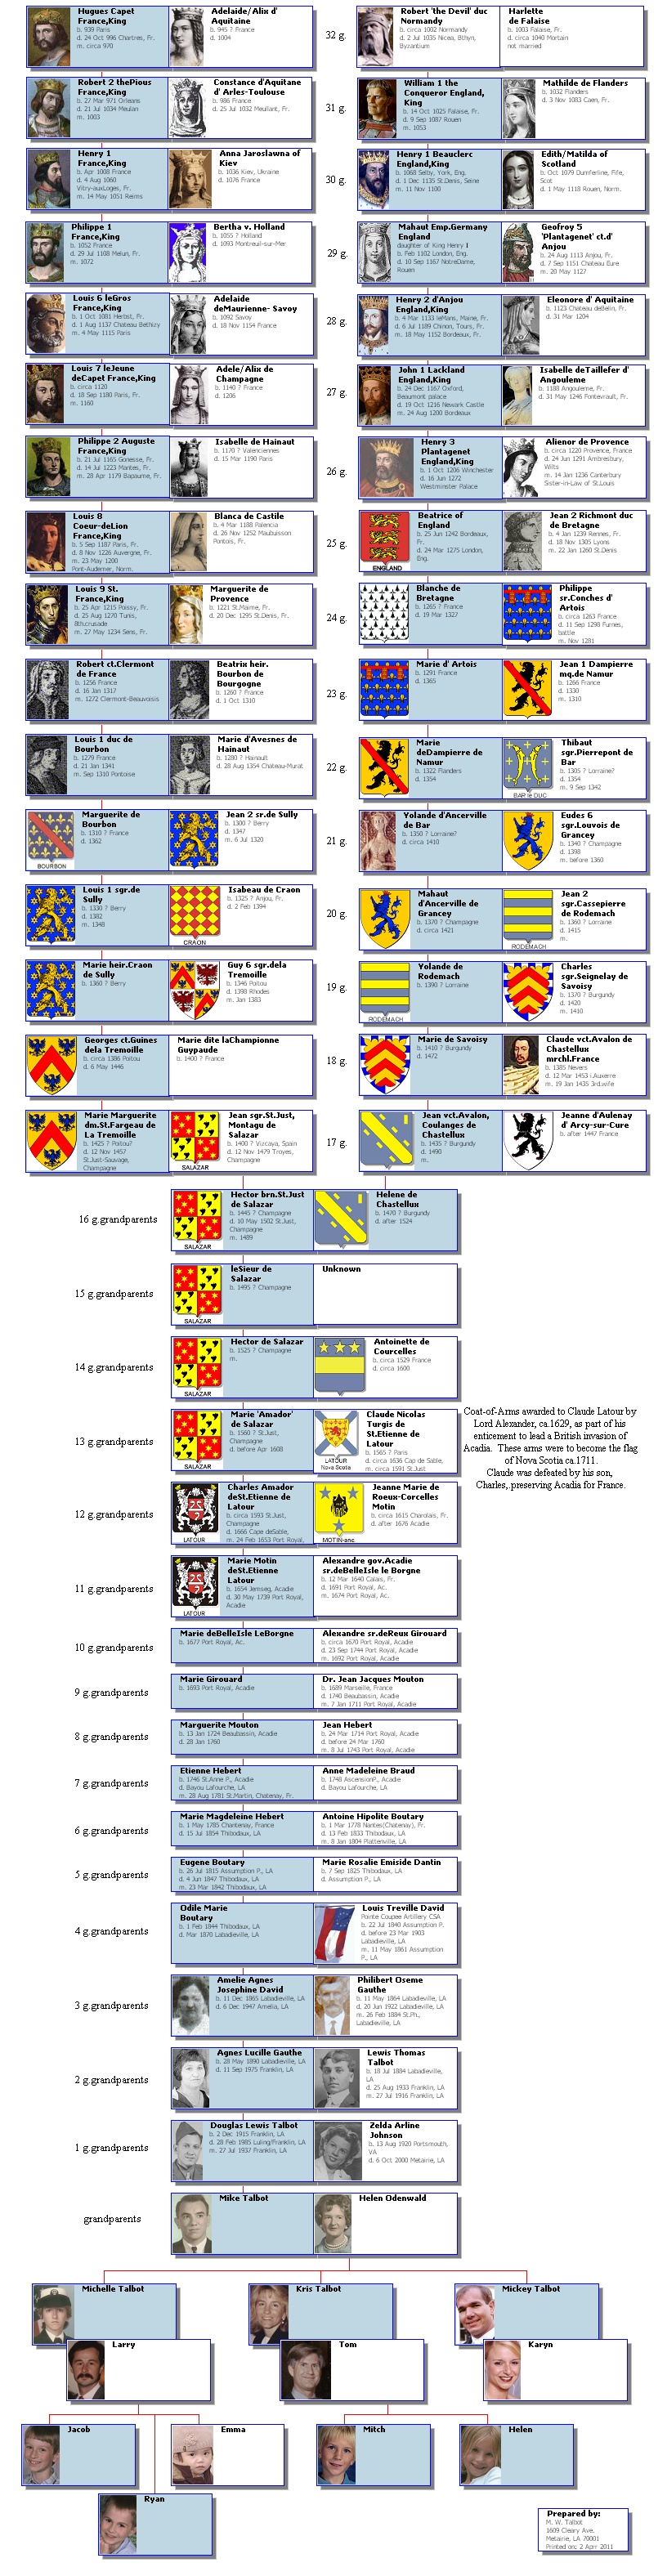
Example of an 8.5 x 33 inch composite chart
This line of descent chart is a composite of components from about 15 standard 5 generations VCF ancestor charts and one 3 gen. descendant chart for a total of 35 generations. It is reasonably certain that no genealogy program could ever generate such a chart as a standard. So, if you want one, you must build your own. Luckily, TMG provides all of the needed tools.
Start with a blank VCF chart.
>One by one, generate standard VCF ancestor charts and hand select the needed boxes. Copy and paste them to the initially blank chart. Then rearrange the boxes as required by your design. Repeat until all needed ancestor boxes are included. There are VCF menu entries that assist you in aligning and spacing the boxes.
>Generate a 3 generations descendant chart. Delete all connector lines and move boxes to the required locations as shown. Copy and paste them to your destination chart.
>Add connector lines as shown.
>Add desired explanatory text. You may now import any desired large images.
This example chart took about half a day to construct, including finding and fixing mistakes. Only the order of constructing the chart is described, here. Details of performing individual tasks are described in numerous places in this forum,
Note: Those confusing spouse connector lines are gone and replaced by overlapping spouse boxes. A single connector line connects a multi-generational line of boxes. Pictures and judicious use of color, make the chart more interesting. You should have identical definitions of boxes for ancestor and descendant charts. Don't forget to save your work, frequently. More lines of descent may be added, each will widen the chart by about 4 inches,
For this example, details on living people were hand deleted from the individual boxes.
For a composite, 4 generations descendant chart with some added ancestors that measures
8.5 inches x 16 feet, see (and scroll):
http://lagenealogy.net/Talbot.aspx
There are hundreds of boxes on that one. There are many other examples of completed VCF edited charts at this site.
Best wishes and enjoy VCF,
(what you see with this forum editor is not exactly what you get. Sorry about that. My first attempt to fix this message in quick edit mode failed. Then the fix was easy in full edit mode.)
.
-
...(snip)...What is the best way to make a chart fit on one page? This is for a grandson's school project.
Virginia's advice is all good. But, there is no magic bullet for making a chart fit on one page. It is highly dependant on your requirements and your data:
1. What type of chart is desired (for a school project, I assume an ancestor chart)
2. How many desired generations on the chart
3. What level of detail is desired on birth, death and marriage data (lifespan or full dates and place names, etc.).
4. Population density on the chart (for example, a 5 gen. ancestor chart has 31 possible people on it. How many of those 31 people are in your database?)
5. How many people on your chart have images to be included?
6. TMG definitions of font sizes, max.image size, box size, inter-box spacing.
7. Are you willing to learn and perfom simple hand editing on your chart with VCF.
Give us more details on the chart needed for your grandson. Maybe all of us on this forum can give you better advice.
Best wishes and good luck,

Talbot, Mike
in TMG Users' Genealogy Web Sites
Posted · Report reply
The old site URLs have been saved (for a fee) by SkyKick services. Please ignore the .zxq URLs. For example, continue to use:
http://LAgenealogy.net/Talbot.aspx
Mike