

Mike Talbot
-
Content count
361 -
Joined
-
Last visited
Posts posted by Mike Talbot
-
-
I've followed some of the helpful suggestions in Terry Reigel's TMG Tips site and have just created TMG screen accents to show relationships to my direct line in different colours. I have split my tree into the 4 main branches (my parents and my wife's parents). For each branch I've created 4 accents, being direct line, siblings of the direct line, other blood relatives, and non-blood relatives. For each branch I've used a different primary colour, with different shades to show the 4 relationships. This gives a total of 16 different accent conditions (there are only 13 colours to represent these, as I've used pale grey for the non-blood relations for all 4 branches).This has worked really well (thanks Terry !).
Now the problem - I did the above without considering VCF. When I go into VCF chart definition, I see there are only 10 available accent conditions. This means I cannot automatically replicate my screen accents when creating charts. I'm therefore wondering whether I've wasted my time!
Please can someone advise if it's possible to increase the available accent conditions in VCF, or an alternative way of replicating my hard work in TMG when I create charts?
Thanks
Kevin
In my way of looking at the requirement, a single standard VCF descendant chart can only contain 4 types of people. Other chart types have the same(hourglass) or fewer(ancestor) possible person types:
1. a person that is an ancestor of your person of interest
2. a spouse that is an ancestor of your person of interest
3. a person (such as a sibling) that is not an ancestor of your person of interest
4. a spouse that is not an ancestor of your person of interest (such as no blood relation)
There are no other person types on a single VCF chart. Unless you wish to further differentiate descendants of the person of interest and their spouses, but that results in only 6 types.
To get more than 4 (or 6) possible types of people, you will need multiple different chart definitions and make a composite chart of multiple separate charts. IE: different color definitions for your family descendant chart and another different set for your wife's family chart, etc.
You can make as many templates of any VCF chart type that you desire, name them and use those definitions again and again. You will then need to make a composite chart of different charts to get the 16 kinds of people that you want.
However, if I were to want such a chart, I would make a composite of standard VCF charts and hand color the boxes in VCF as desired. These seem to be Virginia's suggestions.
Best wishes,
-
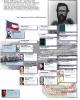
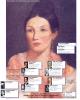
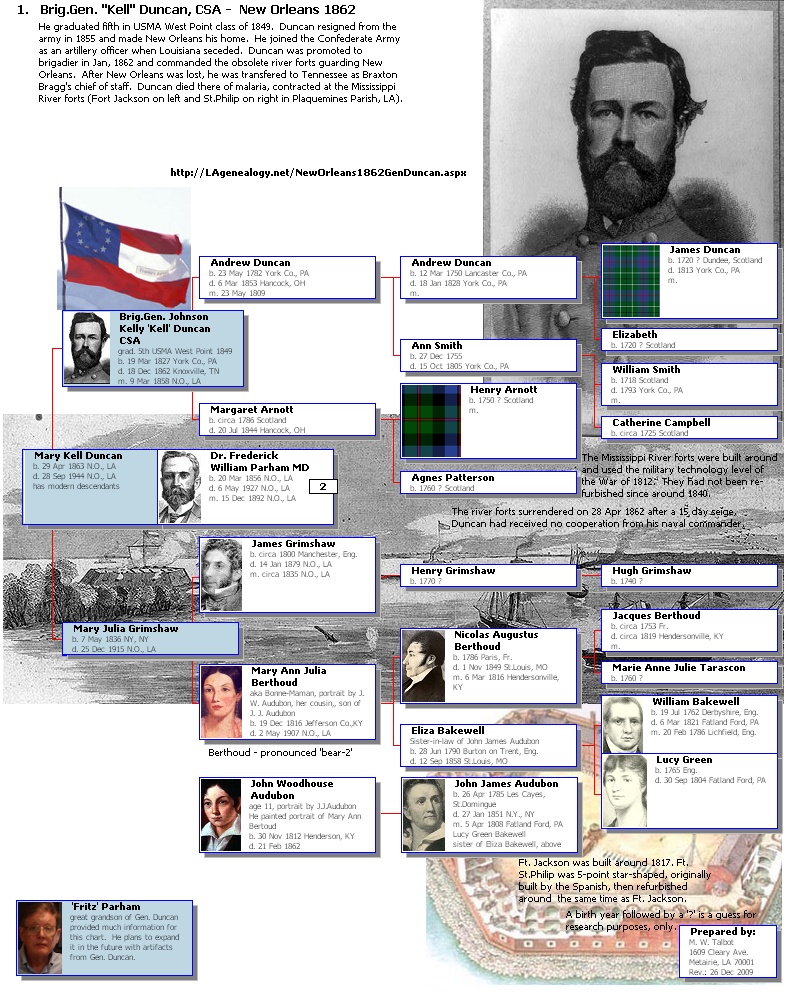
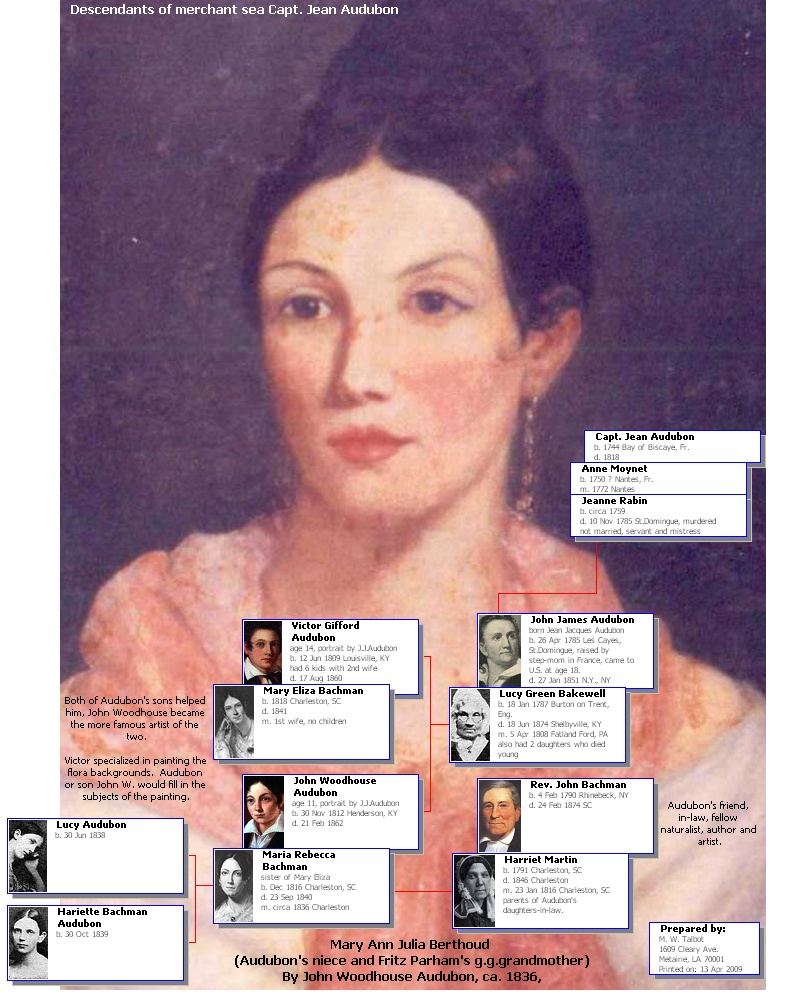
Examples of imported images used as (partial) background(s) of VCF charts from my website. Images were scanned, imported as per Virginia's instructions, resized and sent to back as chart background and moved to the desired location. These examples combined many of my favorite things, dear friends, genealogy, old portraits, military history and artifacts. It doesn't get much better than that.
The first example shows Gen. Johnson Kelly Duncan, who commanded the defense of New Orleans in 1862.
The second example centers around a portrait by John James Audubon's son, John Woodhouse Audubon.
Note: Images are imported into VCF without regard to the original image's resolution (at 96 dpi in VCF, I think). Therefore, an image scanned at 300 dpi will be a little over 3 times as large after imported into VCF. If an original large image has too much resolution its import may swamp VCF with unpredictable results
Best wishes,
-
Thanks, Virginia, the image is in the chart.Next question -- the image is much too large. it was scanned as an 8 x 10 " , but it's coming in as about 24 wide x 20 high. It's in jpg format and I'd like to display the image as an 8 x 10" in the chart. How can I get the image in at the desired size?
Thank you.
Linda
.Select the image by clicking on it - you will see dots at each corner of the image and at the mid-point of each side.
.Hold down the shift key (to maintain the aspect ratio)
.Grab any corner of the image by holding down the left mouse button
.Move the mouse towards the center of the image until the image is the desired size. Release the shift and mouse.
You may now move the image about and repeat resizing until you get exactly what you want. You may also use the back menu entry to pace the image as background to a portion of your chart.
Good luck,
-
Thanks for your ideas Mike. I am currently evaluating whether to change my database of more than 20k individuals over to TMG and I have found in the past that other programs also do not deal with the absence of birth data very well. TMG is unique in its ability to show the baptism date in the pick list, where the birth date is absent and that is great. I currently create my charts manually but was impressed by the TMG charting facility which is very flexible. However more than half of my database individuals have no birth date and I am reluctant to add data just to make reports easier, my plan being to add it only when it adds knowledge or understanding to that individuals life eg. when it becomes obvious that they were baptised at an older age than is usual. I too have many individuals of the same name - at last count more than 160 named John Snell - and find that a suffix denoting origin, and the choice to use expanded pick list and bookmarks enables to find the correct one when adding data.I appreciate your suggestions - thank you for taking time to reply.
Marlene
Investigate John Cardinal's TMG utility program before making a final decision. It performs miracles, sometimes, that I've never imagined. The marriage of TMG and editable VCF charts was enough to switch me to TMG over a decade ago. All else was good, but secondary.
Hope you decide on using TMG. Looking forward to your clear and concise posts on TMG forums in the future.
Best wishes,
-
Is there a way to change Lifespan options show baptism and burials where no birth and deaths data is entered? I don't want to add circa yyyy entries for births and deaths for all my individuals ...Marlene
May I suggest an alternative.
When you have a burial date and no death date, put before "b" that burial date in the death date tag.
When you lack a birth date and have a baptism date, but before "b" that baptism date in the birth date tag.
When no birth/baptism data is available I make a birth year up for every person without one. Nothing is more frustrating than looking for a "John Smith" in an index, then finding most of the several dozen of them have blank dates. Equally confusing is reading a report that contains no dates for several generations.
I invent unknown birth years by calculations from known dates of an ancestor, descendant, spouse or historical event. Then apply a little common sense as a check and round the calculated birth year to one ending with a 5 or 0. Invented birth years are denoted in the birth tag by following the year with a "?'. TMG will show the "?" for birth years in all reports that I use. The average child is born 30 years after its parents. Chidren are born within a few years of parents' marriage, etc.
When death/burial data is unavailable, I leave it blank.
Adopting these standards should give you what you want and will also make indexes and other reports more usable and clearer.
Best wishes,
-
Thanks Terry, I will give it a look. I am not sure I explained very well what I did and I am not sure I know myself. I merged A to B, then B to A, which resulted in two (I think) identical data sets with a full set of duplicates in each. Eliminating one of the data sets would leave me with one data set in which all the people in it are duplicated. Ex: ID 1:1 is the same as ID 1:5001 and 1:2 is the same as 1:5002 and so on. Thanks again.Follow Terry's advice.
Perhaps this will help:
Original.........Contents
Dataset A...a = the original contents of Dataset A
Dataset B...b = the original contents of Dataset B
After copy A to B
Dataset A...a
Dataset B...ba
Then after copy B to A
Dataset A...aba
Dataset B...ba
They are not the same.
Good luck, best wishes and Happy New Year,
-
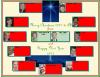
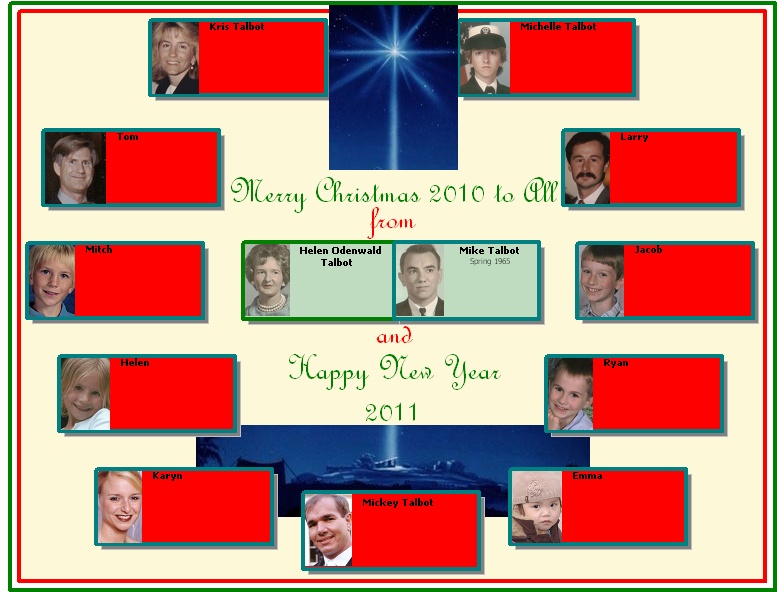
Merry Christmas and Happy New Year
-
Mike,I don't recall the details of how TMG v5 worked, but if it includes the option to have thumbnail images for exhibits, then that could explain a large increase in the size of the project given you have 12,500 exhibits. If the _i.ftp file in your project folder is by far the largest file, then that would tend to confirm my theory.
That was it!!!! The option in prefernces was a bit misleading and must have been the old default, way back then in TMG 5.
New SQZ file size- 17,300,000
Constructing thumbnail upon access takes almost no time. Don't know why this option is there.
Thank you, thank you, thank you,
-
When I upgraded my dataset from TMG 4 to TMG 5, the dataset SQZ file size grew by more than a factor of 10. I was horrified, but assumed it to be a fact of life. Recent discussions on this forum seem to indicate that this problem is not normal and is peculiar to my working dataset.
Specs
Windows XP home (up to date), lots of spare hard disk room. 2 gigs ram.
TMG 7.04
.SQZ file size- 235,000,000 B (seems to be 10 to 30+ times too large)
people- 85,500 people
names- 86,100
external exhibits- 12,500
other stuff- appears to be as expectedl
Help!!! Ideas? Is there a way to reduce dataset file sizes to normal?
Thank you,
-
Just a few thoughts: How about adding images to the boxes. Within reason, if you increase the width of the boxes, you wind up with an overall smaller chart (try 176 pixels, if you frequently encounter long names). It is usually easy to compensate for the added width by overlapping generations 1 and 2. It only takes a moment to do. Remember, individual boxes can be widened or narrowed when needed and appropriate.
How about importing large images where appropriate? They can be partially overlayed by chart components. Not using custom frames will gain much room on the chart and simplify the job. Their sizzle can be replaced by having images.
Nice work, keep those good ideas coming,
-
I agree with almost everything that Terry and Andy have said about GEDCOM and GenBridge. Sure, GEDCOM is not much, but it's all we've got to communicate data with most people who do not have the wisdom to use TMG. More people use the many shareware and other genealogical programs than those versions covered by "one-way" GenBridge. More importantly, sharing genealogy data must be a two-way street.
Besides, GEDCOM was only a third of my points. Using saved resources to add genealogy oriented features was the most important part of my plea. See all of the unanswered wish-list items over the past few years. Many have merit, even though some don't. Eventually addressing pending FoxPro problems was the third point.
Best wishes,
-
Link to postings:http://www.whollygenes.com/forums201/index...?showtopic=5991
The link is also in the pinned message 'One-page-charts' at the top of VCF forum.
Virginia
Thanks again, Virginia.
Best wishes,
-
I am interested in the Pedigree Booklets that Patt and Teresa have posted. I am talking about charts to our Boston TMG user group this Saturday and I thought the Pedigree Booklet is such a good idea. It would be a nice topic. However - I have some questions.....1. I don't quite understand the basic format of how you print the charts on a page. Are you printing the center two charts (the subjects fathers ancestors and mothers ancestors) on one page, so that when the book opens up you see both charts? Or is there one chart to a page, and then the pages get pasted together?
2. Teresa said 'The mother goes on the left side, the father on the right'.
Patt's chart has the father on the left and the mother on the right.
Is there a general consensus as to which one goes where?
Actually I think I prefer the father on the left and the mother on the right, but I will go with the acceptable norm
3. Patt's booklet has the chart for the first two pages, and then starts printing the extended charts, starting with the father. Even though the father's chart is a left-to-right chart, when the extended charts are printed, they are right-to-left charts. Is that the usual practice?
4. How do you get page numbers? Manually?
5. The 'continued on ' phrase - I assume that is entered manually. If not, then you would get the phrase when there is no continuation.....
6. Is each chart created one-by-one? I.e. enter the person's number, print, enter next person's number, print, etc.
Sorry for all the questions, but it's such a neat idea.
Thanks for the help
Linda Reinfeld
Thank you for your description of Patt and Theresa's booklets. The booklets sound like a great idea !!! If any one knows Patt and Theresa, please ask them to post procedures and examples for their booklets as a topic on this forum. It would be greatly appreciated by all.
Using TMG, each pedigree chart is generated separately via the subject's ID number or name. Once generated to VCF, charts may be hand edited, combined, saved to a file and printed. The chart files can be recalled later, and processeed further, using VCF.
Best wishes,
-
Directly importing other popular genealogy program databases into TMG was a great idea and feature over a decade ago. There were few popular premium genealogy programs and they were fairly stable in those days.
In my opinion, all of that has been changing. New popular genealogy programs are rapidly born and soon die. Those that survive seem to change format details quite often, as does TMG. Spending resources on GenBridge appears to be becoming more and more ineffective and futile.
Perhaps those resources would be more effectively allocated to GEDCOM import and export support and added genealogy report/chart oriented features. In addition, serious FoxPro problems seem to be looming on the horizon and must be addressed, eventually.
Just food for thought and wishes for a great future,
-
Is there a way in TMG7/VCF to display a box for Partners (i.e. unmarried people living together and maybe having children) as well as Spouses?Thanks
David
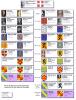
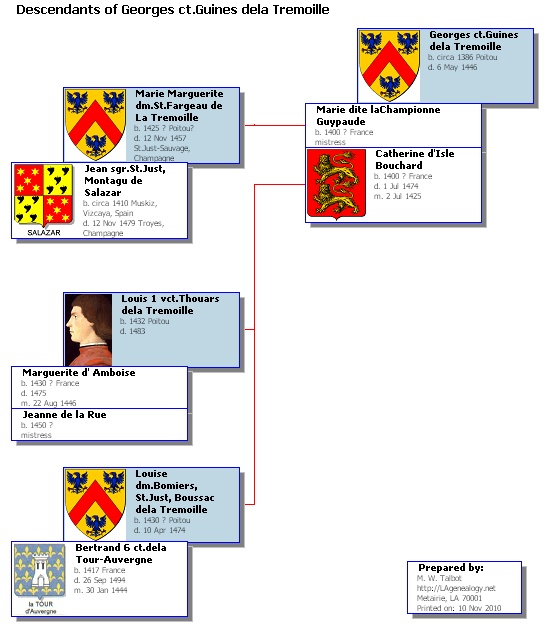
This is the way that I do it. It takes a moment of hand editing in VCF.
Define a relationship (not married or partner, etc.) tag(s) in the marriage group. Use it instead of the marriage tag for your special partner cases. Children if any, will display correctly in descendant charts or other reports.
Generate a standard descendant chart.
See Attachment 1 for a standard 2 generation chart. Note that married partners will have a line in the box of their spouses for the marriage date/place. Those with your non-standard relationship tag will not.
Hand enter the data line that you want to appear instead of the missing marriage data line in your special partner box(es). Example: mistress. You can optionally get rid of those confusing connector lines that make spouses look like descendants and replace them by overlapping the boxes. You can also color shade the descendants of the subject of the chart. The added color highlights descendants in contrast with spouses and takes only moments to do. See Attachment 2 for the way that I do it. Note the hand entered pseudo-marriage lines. (See posts in this forum by Virginia, Robin and me for detailed techniques).
Best wishes,
-
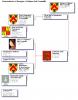
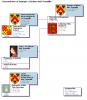
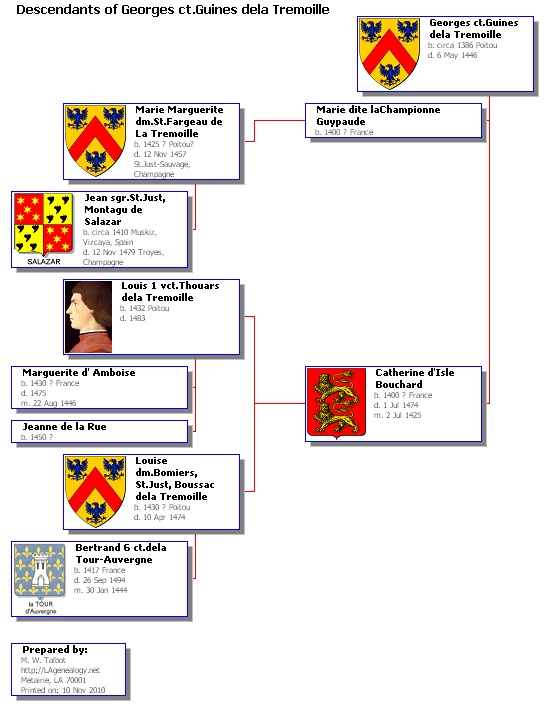
This attached Relationship Chart is a composite of several standard VCF ancestor charts. Its purpose was to show the relationship of people actively compiling and sharing information on their family research. It took a pleasant afternoon to constuct and the results enjoyed by many relatives.
VCF standard Ancestor Charts were generated with TMG and the needed individual boxes were copied and then pasted to a blank chart. The boxes were then moved to fit on a 14 x 8.5 inches page and colored. Connector lines were drawn, explanatory text was added and the chart was trimmed. Details on living persons were deleted for this presentation.
The chart was the work of a long, but pleasant afternoon. A few hours of work would have been saved if TMG would change the standard text graphics Relationship Chart to a VCF chart.
Enjoy VCF to make useful charts that no genealogy program could possibly do as a standard.
-
Virginia,At First thought it was removed, but I found now where the topic had gone to.
I was doing exactly what u told me. Set it back on default and set to view in visual chart form.
Just like I do when I make a report like Journal report which opens in PDF.
When I do it with all Box chart reports that should give preview in VCF nothing happens.
Don't think anything is blocking VCF, I even set off my virusscanner.
Indeed just like connection between programm and VCF is blocked.
Do I have to install VCF as a printer somewhere in TMG to make a preview ?
regards,
Paul
Do not install VCF as a printer. VCF is a (separate from TMG) charting/drawing program and is linked to by the TMG genealogy program. TMG passes your requested report definition and user defined parameters to the VCF program as arguments. This occurs automatically when you request TMG to Create Chart.
You can use VCF to hand create your own drawings without using TMG. Have you tried that? The VCF screen contains the chart or drawing, whether it was invoked by TMG or done by hand. The preview option only shows you how the printed drawing would look.
I have no experience with Windows 7. But, grasping at straws: long ago with XP and TMG 5, VCF would fail to run if I had done a "naughty" in the previous use of VCF. A Reboot was needed to clear this problem. I have not experienced this problem with TMG 7. Have you tried to Reboot since you noticed this problem?
Sorry, but that's all I've got,
-
Hi Mike -I like very much your 5-generation ancestor chart. And the instructions are good.
I especially liked the 'move to front' button - I've never done that before. Great tool!
However, my chart doesn't fit on one page - the 5th generation spills over to another page by 5 1/2 people.
I am sure it has something to do with font size, box size, margins, gap between boxes.
Also I have photos, and my photos only take up about 1/2 to 1/3 of the box, whereas I notice yours are the whole size of the box....
Some times my names wrap, and some of those wrapped names have a blank line 1st before the data starts.
Is there another entry in the forum where you have identified all the options?
Thanks very much for all the charts you do -
Linda Reinfeld
Yes, Virginia, Robin and I have posted recommended/example box, font, spacing (always use minimum), max. exhibit size parameters and other VCF techniques on this forum over the past couple of years.
There are max.width and max.height parameters for pictures/exhibits that you define in TMG for generating VCF charts. Whichever of these limits your picture hits first will determine the picture size in a VCF box. It seems like your pictures might be too wide for your TMG maximum width limit to produce what you want.
If all else fails, attach a copy of your problem chart to a message here. Perhaps someone can offer suggestions.
Best wishes,
-
Please consider my annual plea for two TMG report augmentations:
-
Add spouses option to the Descendant Indented Narrative report.
-
Add spouse of record option to the Ahnentafel - Direct Line report.
I would love to use such reports, but without spouses they are totally useless to me.
Thank you,
-
Add spouses option to the Descendant Indented Narrative report.
-
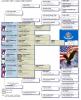
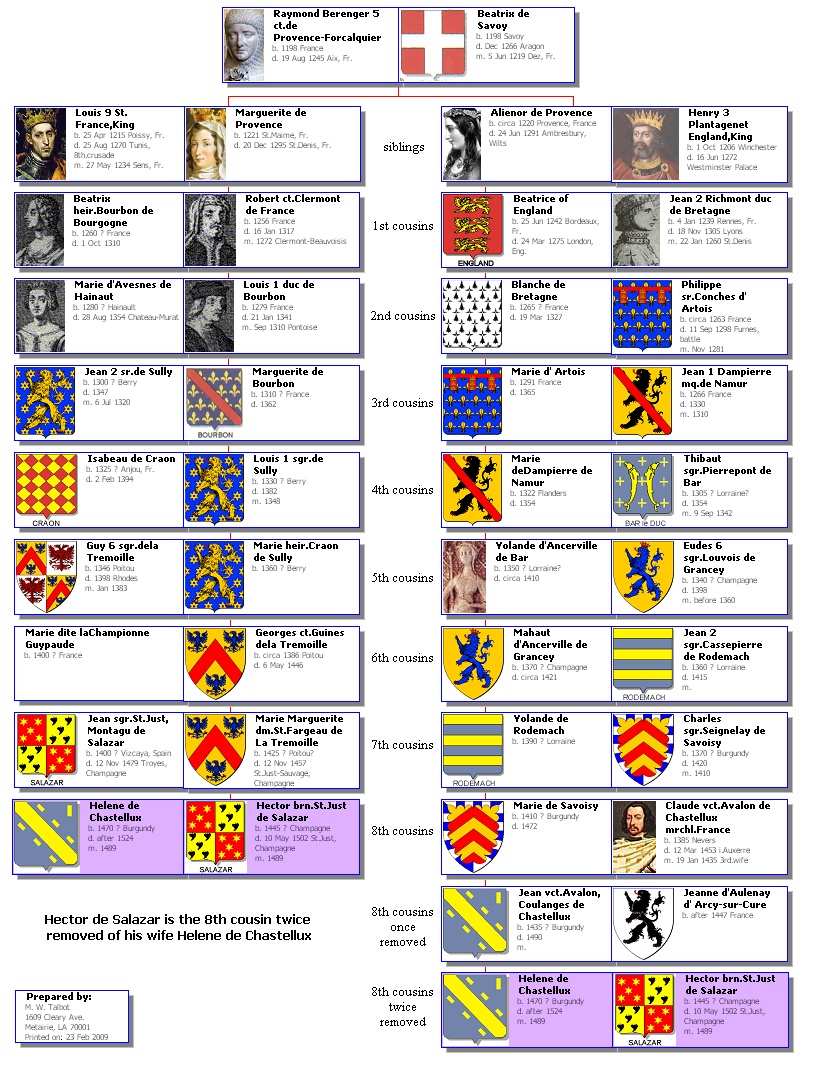
Please consider my annual plea for a TMG generated-VCF Relationship Chart.
The TMG current, horrid, but useful text graphics chart is ugly, truncates long items, takes lots of paper and does not support images. It is also very difficult to hand edit to restore important truncations. Every change causes an alignment problem which must then be fixed. Supporting Relationship Charts with VCF would correct all of these many errors and problems.
The attached hand crafted VCF relationship chart shows a 12 generations relationship on a single page. It is proposed as one possible model for TMG implementation. As is, it is a composite of 5 standard VCF Ancestor Charts and is 8.5 x 11 inches. It took somewhat over an hour to construct and edit, but was worth the effort to me.
Thank you,
-
<snip>... you could accomplish the same goal with a single hourglass chart, but this way is far less crowded, easier and more efficient.
<snip>
Not true. This project could not be accomplished with a single hourglass chart.
You need to begin with a standard 2 generation descendant chart of the mother or father. Then, generate a standard 5 generation ancestor chart of any one of the children. The rest of the procedure is correct.
Sorry about that,
-
Mike, I assume you are saying to put the nickname in quotes in the Primary Name Tag, rather than in the Name-Nick tag? The advantage of that is it appears as the "title" name in TMG reports and charts, and in sites created with Second Site.But I can see a couple of disadvantages. One is that it won't show up in it's proper alphabetical location in the Picklist, name indexes, or list of name in sites created with Second Site. Another is that it will appear whenever the full name is used in narratives, unless you create a separate Name Tag without the nickname and specify that in Tags which will use the full name.
Choices, choices.

I prefer to use the Name-Nick tag, and modify the sentence as needed. For example, my default sentence says "He was known to family as..." but on occasion I change it to "He used the name ... except for a few formal occasions" or "As an adult he generally went by..." depending on what I can learn about the subject's practices.
Your assumption of the primary name tag is correct. What an imbeded nickname does to the sort order and index depends on where you put the nickname in the given name field. I put the nickname(s) last in the field, so it affects nothing but the given name field length. No other tags or complex sentence structure additions are needed. Depending on your goals and taste, though, TMG lets you put it wherever you like.
I have never used the Name-Nick Tag nor have needed to explain a nickname in quotes/apostrophies in the primary given name field to anyone. Data is shared frequently with 1st thru n th cousins.
Another advantage of imbeded nicknames is that no special attention is needed to get nicknames to appear on VCF charts, of which I am fond. I only use Name-Var Tags for noms de plume, stage names or deliberately disguised names. It keeps things simple. A major beauty of TMG, is that you can make things as easy or as complex as pleases you. How TMG data is entered and displayed is all a matter of taste of the individual user.
Thanks for the clarification,
-
It certainly isn't obvious to me.The only thing I can assume is that I am supposed to edit the sentence and change "Nickname" to the desired nickname, but that just seems ridiculous!
Can anyone advise?
Regards,
Strathglass.
You can include the nickname enclosed in quotes or apostraphies in the given name field. This is the way most newspaper obituaries present nicknames and so do I. That way a nickname is obvious to anyone who has ever read an obit, so no sentence or prose changes are necessary.
The beauty of TMG is that you can do it, and most things, the way that pleases you.
Best wishes,
-
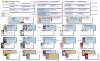
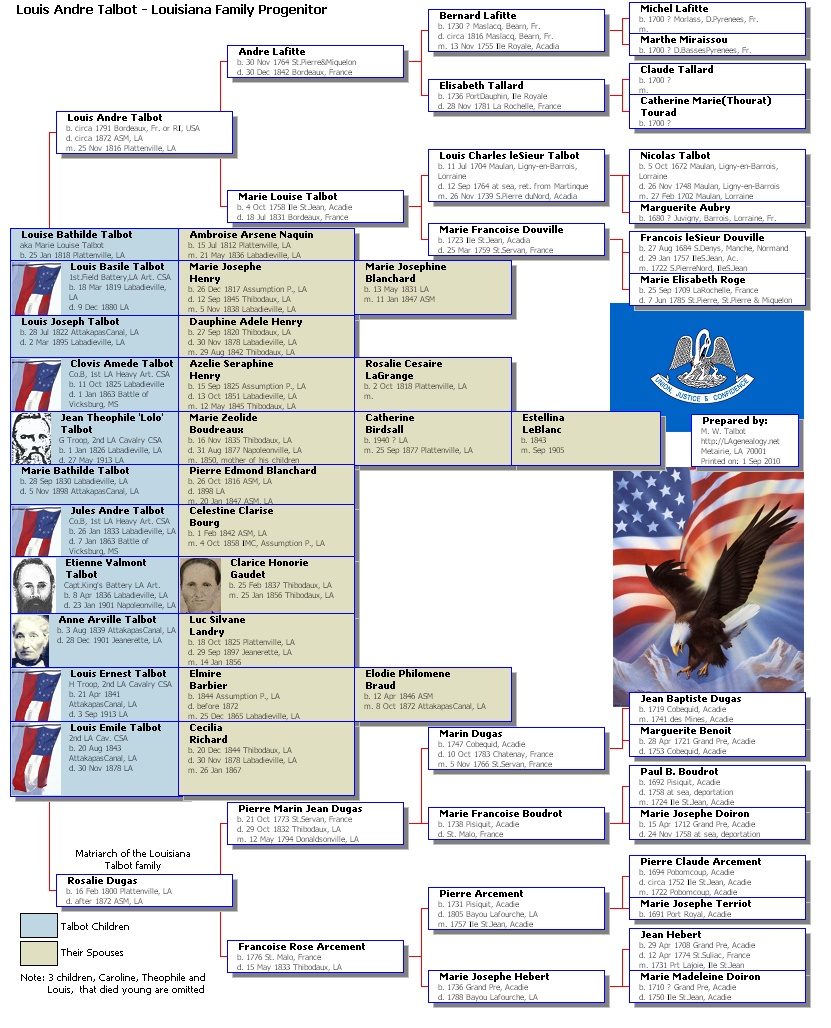
The 8.5 x 14 inches paper, five-generation chart with siblings and spouses can be reduced in size to 8.5 x 11 inches in 10 to 15 minutes of further VCF editing. Note, chart sizes are for these examples, the same techniques can be used for any standard paper sizes.
Chart size reduction is done by overlapping the siblings and spouses boxes and moving the ancestor's boxes vertically closer together in groups and individually. The two imported pictures are also individually reduced in size.
To do so, use the arrow keys to gently and accurately jog groups and single box components to the desired locations. Frequently use the View > Zoom to Fit or Zoom Normal keys, where appropriate, to see better what you are doing.
The completed 8.5 x 11 chart is attached.
Best wishes,

5 generation ancestor chart
in Visual Chartform and Chartform Delivery
Posted · Report reply
The procedure in my original post in this topic does not effect connector lines nor their connections. The move to front of each of the three boxes will cover the offending connector lines if the boxes are opaque.
In TMG, the chart definition option for box fill must have color or color by generation parameter selected. Selecting transparent fill would cause your symptoms.
Let us know if this helps.
Good luck,